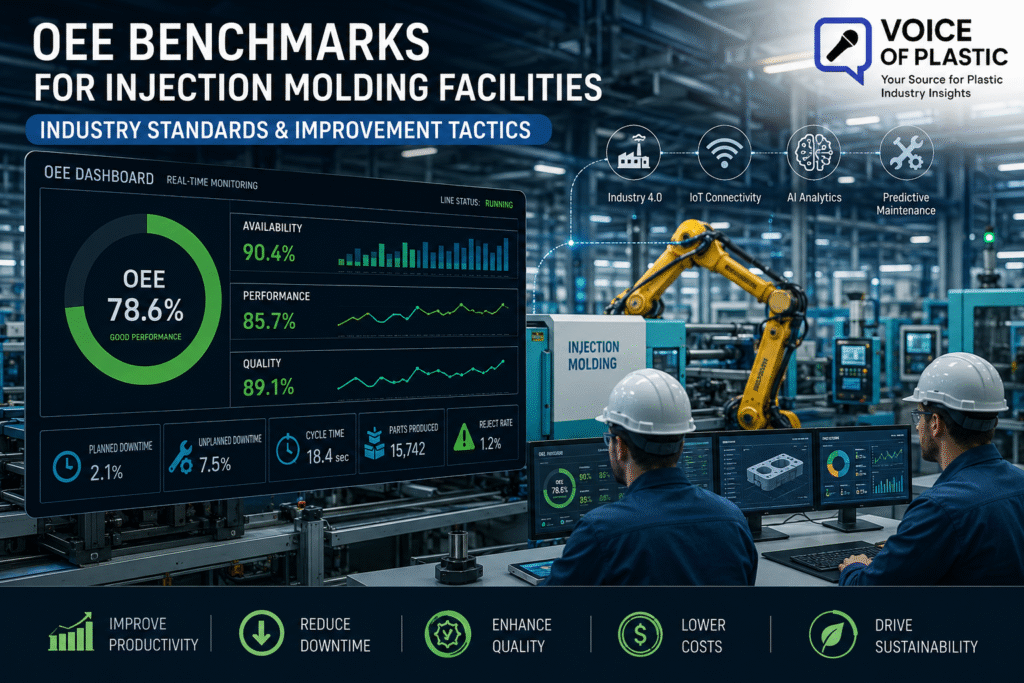
OEE Benchmarks for Injection Molding Facilities: Industry Standards and Improvement Tactics
In today’s competitive plastic manufacturing landscape, a single percentage point of Overall Equipment Effectiveness (OEE) can mean the difference between healthy margins and eroding profits. Global competition has intensified. Energy costs remain volatile. Customer expectations for quality, speed, and sustainability keep rising. Industry 4.0 technologies have raised the performance bar, yet many injection molding plants still operate far below their potential.
A recent industry survey of mid-sized molding facilities showed average OEE hovering around 55–65 percent. World-class plants consistently exceed 85 percent. The gap represents lost capacity, higher unit costs, and missed opportunities. Monitoring and improving OEE is no longer optional. It is the clearest path to sustainable growth for plant managers, production engineers, continuous-improvement teams, and factory owners.
This guide delivers current OEE benchmarks for injection molding, breaks down the three core components with real plant examples, compares performance across major sectors, and provides practical tactics that have delivered double-digit gains. You will also find realistic case studies, KPI tables, and a clear roadmap you can start applying this quarter.
What is OEE?
Overall Equipment Effectiveness measures how well a manufacturing asset performs relative to its full potential during the time it is scheduled to run. The metric originated in the 1960s within Toyota’s Total Productive Maintenance (TPM) framework and was popularized by Seiichi Nakajima. Today it is a universal manufacturing KPI used from automotive to medical device plants.
Injection molding companies rely on OEE because the process is highly capital-intensive. Machines, molds, and auxiliary equipment represent large investments. Any lost time, slow cycles, or defective parts directly erode return on that capital. OEE translates complex shop-floor reality into three understandable numbers that drive daily decisions.
The classic formula is:
OEE = Availability × Performance × Quality
Each factor is expressed as a percentage, and the product yields the overall score. A plant that scores 90 percent Availability, 95 percent Performance, and 99 percent Quality achieves an OEE of approximately 85 percent—commonly accepted as world-class.
Understanding the Three Components
Availability
Availability measures the percentage of scheduled time that the machine is actually producing. Losses include:
- Unplanned breakdowns
- Tool changes and mold setups
- Material shortages or drying delays
- Waiting for operators or quality clearance
- Planned maintenance that overruns its window
Example: A 400-ton press is scheduled for 20 hours. It loses 2.5 hours to a hydraulic leak and another 1 hour to a mold change that should have taken 30 minutes. Availability drops to 82.5 percent.
Performance
Performance compares actual cycle time and output rate against the ideal or designed cycle time. Losses appear as:
- Slow cycles caused by conservative process settings
- Minor stoppages (nozzle freeze, part stick, robot wait)
- Speed reductions due to material variation or cooling limitations
Example: The theoretical cycle time is 18 seconds. The actual average is 22 seconds because of extended cooling and occasional robot delays. Performance equals 18/22 ≈ 82 percent.
Quality
Quality is the percentage of good parts produced versus total parts started. Typical defects in injection molding include:
- Flash
- Short shots
- Sink marks
- Warpage
- Dimensional out-of-spec
- Contamination or color variation
Rework that returns parts to the process is also counted as a quality loss until the part is accepted.
Example: Of 10,000 shots, 350 are rejected for sink and flash. Quality = 96.5 percent.
When these three factors multiply, even moderate losses compound quickly. A plant with 85 percent Availability, 85 percent Performance, and 95 percent Quality ends up with only 68.6 percent OEE.
OEE Benchmarks for Injection Molding
Industry data from multiple sources (including APQC, Plastics Industry Association studies, and consulting firm benchmarks updated through 2025) provide the following practical ranges for injection molding facilities:
| Category | Availability | Performance | Quality | Overall OEE |
|---|---|---|---|---|
| Poor | < 70% | < 70% | < 90% | < 50% |
| Average | 70–80% | 70–85% | 90–95% | 50–65% |
| Good | 80–90% | 85–92% | 95–98% | 65–80% |
| Excellent | 90–95% | 92–97% | 98–99% | 80–85% |
| World Class | > 95% | > 97% | > 99% | > 85% |
These figures assume continuous or near-continuous operation and exclude pure job-shop environments with extreme product variety. World-class scores are routinely achieved by high-volume automotive and medical molders that combine disciplined TPM, SMED, and real-time monitoring.
Industry Benchmarks
OEE varies significantly by sector because of differences in part complexity, quality requirements, mold change frequency, and regulatory oversight.
| Sector | Typical OEE Range | Availability Focus | Performance Focus | Quality Focus |
|---|---|---|---|---|
| Automotive | 70–85% | High | High | Very High |
| Packaging (thin-wall) | 75–90% | Very High | Extremely High | High |
| Medical Devices | 65–80% | High | Moderate | Extremely High |
| Consumer Goods | 60–75% | Moderate | High | High |
| Electrical Components | 65–80% | High | High | Very High |
| Industrial Components | 55–70% | Moderate | Moderate | High |
| Thin-Wall Molding | 80–92% | Very High | Extremely High | High |
| High-Precision Molding | 60–75% | High | Moderate | Extremely High |
Thin-wall packaging often leads in overall OEE because cycle times are short and volumes are high, making every second visible. Medical and high-precision molders sacrifice some speed for validation and documentation requirements, which lowers Performance and sometimes Availability.
Top Reasons for Low OEE
Root-cause analysis across dozens of plants consistently points to the same cluster of issues:
- Machine breakdowns and reactive maintenance – Hydraulic leaks, heater band failures, and sensor faults dominate unplanned downtime.
- Long or poorly standardized setups – Mold changes that take 2–4 hours instead of 20–40 minutes destroy Availability.
- Material variation and drying problems – Moisture or lot-to-lot differences force process adjustments and scrap.
- Poor mold maintenance – Worn vents, damaged ejectors, and cooling circuit blockages create quality and cycle-time losses.
- Operator and process inconsistency – Different shifts run different parameters.
- Inadequate cooling or incorrect water temperature – Extends cycle time and causes warpage.
- Aging machinery without proper upgrades – Older presses lack closed-loop control and modern safety interlocks.
- Lack of real-time visibility – Problems are discovered hours or shifts later.
- Insufficient automation – Manual part removal and inspection add stoppages.
- Process instability from inadequate scientific molding practices.
A simple Pareto analysis of downtime logs usually reveals that the top three causes account for 60–70 percent of total losses.
How to Improve OEE
Sustainable improvement requires a structured combination of tools rather than isolated projects.
SMED (Single-Minute Exchange of Die) Separate internal and external setup activities. Convert as many tasks as possible to external. Use quick-clamp systems, standardized mold bases, and pre-staged materials. Plants that apply SMED rigorously cut changeover time by 50–75 percent within six months.
Total Productive Maintenance (TPM) Move from reactive to preventive and predictive maintenance. Autonomous maintenance by operators (cleaning, lubrication, inspection) combined with planned specialist work dramatically raises Availability. World-class plants target less than 2 percent unplanned downtime.
Lean Manufacturing and Kaizen Eliminate the seven wastes. Value-stream mapping of the molding cell often reveals excess motion, waiting, and over-processing. Daily Kaizen boards keep small improvements continuous.
Six Sigma and Process Control Use DOE (Design of Experiments) and scientific molding to establish robust process windows. Reduce variation so that cycle time and quality remain stable across shifts and material lots.
Poka-Yoke and Visual Management Error-proofing devices prevent short shots, wrong material, or incorrect inserts. Andon lights and real-time dashboards make problems immediately visible.
Digital Factory Tools MES (Manufacturing Execution Systems), IoT sensors, and AI-based process monitoring close the loop. Real-time OEE dashboards allow supervisors to intervene within minutes rather than hours.
A typical improvement sequence looks like this:
| Phase | Focus Areas | Expected OEE Gain | Timeline |
|---|---|---|---|
| 1 | Quick wins (SMED, 5S, basic TPM) | +8–12 points | 3–6 months |
| 2 | Process standardization & Six Sigma | +5–10 points | 6–12 months |
| 3 | MES + predictive maintenance | +5–8 points | 9–18 months |
| 4 | Advanced automation & AI | +3–7 points | 12–24 months |
Machine Monitoring
Modern injection molding plants rely on layered monitoring:
- SCADA and PLC data for machine signals
- MES for production scheduling, OEE calculation, and traceability
- IoT sensors on molds, oil temperature, vibration, and energy
- Cloud platforms for multi-plant visibility
- Industrial AI and predictive analytics that forecast failures days in advance
- Digital twins that simulate process changes before implementation
These systems turn OEE from a lagging monthly report into a live management tool. Plants that implement comprehensive monitoring typically recover 5–15 percentage points of OEE within the first year through faster response and better prioritization of maintenance.
KPIs Every Injection Molding Plant Should Track
OEE is the headline metric, but supporting KPIs provide the diagnostic detail:
| KPI | Target (Good/Excellent) | Frequency | Owner |
|---|---|---|---|
| Overall OEE | 75% / 85%+ | Real-time / Shift | Production Mgr |
| Availability | 90% / 95%+ | Real-time | Maintenance |
| Performance | 90% / 95%+ | Real-time | Process Eng. |
| Quality | 98% / 99.5%+ | Real-time | Quality |
| Cycle Time vs Standard | < 5% variance | Real-time | Process Eng. |
| Machine Utilization | 85%+ | Daily | Production |
| Planned vs Unplanned Downtime | > 80% planned | Weekly | Maintenance |
| Scrap / Rejection Rate | < 1.5% / < 0.5% | Shift | Quality |
| Setup / Changeover Time | < 30 min average | Per change | Production |
| Tool Life (shots) | Tracked vs plan | Per mold | Tooling |
| On-Time Delivery | > 98% | Weekly | Planning |
| Energy per kg processed | Continuous reduction | Monthly | Facilities |
| Customer Complaints | Near zero | Monthly | Quality |
Tracking these in a single dashboard prevents tunnel vision on any one metric.
Case Study: 25-Machine Plant Raises OEE from 54% to 81%
A mid-sized automotive and industrial components molder operated 25 injection machines ranging from 150 to 1,000 tons. Baseline OEE was 54 percent (Availability 78%, Performance 76%, Quality 91%). Annual scrap and downtime costs exceeded $1.8 million.
Actions taken over 18 months:
- Implemented SMED across all molds; average changeover fell from equestrians 3.2 hours to 42 minutes.
- Launched autonomous and preventive maintenance under TPM; unplanned downtime dropped 60 percent.
- Standardized scientific molding processes and introduced real-time process monitoring.
- Installed a lightweight MES with OEE dashboards and Andon.
- Trained all operators and technicians in visual management and basic problem-solving.
- Added predictive sensors on critical hydraulic and cooling systems.
Results:
- OEE rose to 81 percent (Availability 93%, Performance 91%, Quality 95.5%).
- Annual savings in scrap, overtime, and recovered capacity exceeded $2.4 million.
- Payback on total investment (training, sensors, MES, tooling upgrades) occurred in 11 months.
- Customer on-time delivery improved from 91 percent to 98.5 percent.
Key lessons: Leadership commitment, cross-functional ownership, and focusing first on the biggest losses (setups and breakdowns) created early momentum that funded later digital investments.
Industry 4.0 and Future Trends
The next wave of OEE improvement will come from deeper integration of data and intelligence:
- AI and machine learning that automatically adjust process parameters in real time
- Computer vision systems that detect defects at the machine rather than at inspection
- Predictive maintenance models that reduce unplanned downtime below 1 percent
- Cloud-based multi-site benchmarking and best-practice sharing
- Digital twins for virtual tryouts of new molds and materials
- Energy and carbon footprint optimization tied directly to OEE dashboards
- Greater autonomy in lights-out or low-manpower cells for high-volume, stable products
Sustainability is becoming inseparable from OEE. Lower scrap, shorter cycles, and optimized energy use simultaneously improve the metric and reduce environmental impact—an increasingly important factor for automotive, medical, and consumer brand customers.
Common Mistakes When Measuring OEE
- Using theoretical rather than actual available time.
- Ignoring minor stoppages under a certain duration.
- Counting rework as good parts.
- Measuring only a few “hero” machines instead of the whole plant.
- Failing to update ideal cycle times when processes improve.
- Treating OEE as a monthly report rather than a daily management tool.
- Setting unrealistic targets without addressing root causes.
- Blaming operators instead of systems and processes.
- Neglecting data accuracy and sensor calibration.
- Focusing solely on OEE while ignoring safety, delivery, and cost.
Best Practices – 20 Actionable Recommendations
- Calculate OEE at the machine level in real time.
- Display live OEE and loss Pareto charts on the shop floor.
- Hold daily 10-minute OEE stand-up meetings.
- Apply SMED to the top 20 percent of molds that cause 80 percent of changeover time.
- Implement autonomous maintenance checklists for every machine.
- Use scientific molding and DOE to lock in robust processes.
- Standardize material handling and drying procedures.
- Track mold condition and preventive maintenance by shot count.
- Install basic IoT sensors for temperature, pressure, and vibration.
- Link OEE improvement goals to operator and supervisor incentives.
- Conduct monthly cross-plant or cross-shift benchmarking.
- Train every technician in root-cause analysis (5-Why and fishbone).
- Reduce planned downtime windows through better scheduling.
- Audit data accuracy quarterly.
- Integrate energy monitoring with OEE dashboards.
- Create a formal continuous-improvement backlog ranked by OEE impact.
- Involve quality early in process development to protect the Quality factor.
- Use visual management for mold and tooling readiness.
- Review ideal cycle times at least annually or after major process changes.
- Celebrate and publicize OEE gains to build momentum.
Frequently Asked Questions
What is a good OEE for injection molding? Good is typically 65–80 percent. Excellent starts at 80 percent, and world-class exceeds 85 percent.
How is OEE calculated in injection molding? OEE = Availability × Performance × Quality, where each component is measured against planned production time, ideal cycle time, and total parts started.
What is world-class OEE in plastics? Consistently above 85 percent with Availability >95 percent, Performance >97 percent, and Quality >99 percent.
Why is OEE lower in medical molding? Stricter validation, documentation, and change-control requirements increase planned downtime and sometimes limit aggressive cycle-time reduction.
How does Industry 4.0 improve OEE? Real-time data, predictive analytics, and automated responses reduce reaction time to losses and enable continuous optimization.
What is the biggest OEE killer in most plants? Unplanned downtime combined with long changeovers usually accounts for the largest share of losses.
Can small job shops achieve high OEE? Yes, by focusing on rapid changeovers, standardized processes, and disciplined maintenance even with high product variety.
How often should OEE be reviewed? Daily at the machine and shift level; weekly for trend analysis and action planning.
Does OEE include planned maintenance? Planned maintenance is excluded from available time if it is scheduled outside production windows. Overruns become Availability losses.
What software is best for OEE tracking? Modern MES platforms with native injection-machine connectivity or specialized OEE modules integrated with existing SCADA.
How does scrap affect OEE? Scrap directly reduces the Quality factor and often triggers additional downtime for process correction.
Is 100 percent OEE realistic? No. World-class plants accept that some losses are inevitable and focus on continuous reduction rather than perfection.
How do I start improving OEE tomorrow? Measure current losses accurately for one week, identify the top three causes, and launch a focused Kaizen or SMED event on the largest one.
What role does mold design play in OEE? Excellent mold design with proper cooling, venting, and ejection supports faster cycles and higher first-pass quality.
How does energy efficiency relate to OEE? Shorter cycles and less scrap usually lower energy per good part, creating a dual benefit for cost and sustainability.
Conclusion
OEE remains the most powerful single metric for understanding and improving the health of an injection molding operation. The benchmarks are clear: average plants sit in the mid-50s to mid-60s, good plants reach the 70s, and world-class facilities operate above 85 percent. The gap is closed not by heroic efforts but by systematic application of TPM, SMED, scientific process control, and increasingly by Industry 4.0 tools.
Begin by establishing accurate measurement. Attack the largest losses first. Build capability through training and standardized work. Layer in real-time visibility and predictive tools. Track supporting KPIs so that gains in OEE translate into lower cost, higher capacity, better delivery, and reduced environmental impact.
The plants that treat OEE as a living management system rather than a monthly scorecard will be the ones that thrive under rising global competition and customer expectations. Start measuring rigorously today, and the improvement tactics outlined here will deliver measurable results within months—not years.
Monitor your OEE. Improve it deliberately. Sustain the gains. That is the practical path to competitive advantage in plastic manufacturing.
✅ Read more (Voice of Plastic – www.voiceofplastic.com)
- Health care plastic
- Plastic automotive trends in EV
- Emerging markets -Plastic manufacturing opportunies
- self healing polymer
- Barrier coating
- Pyrolysis recycling for mixed plastic
🌐 Authoritative References
- ISO 22400-2:2014 International Organization for Standardization. (2014). Automation systems and integration — Key performance indicators (KPIs) for manufacturing operations management — Part 2: Definitions and descriptions. ISO. https://www.iso.org/standard/54497.html (Primary reference for the formal definition of OEE = Availability × Performance × Quality and the underlying time/quantity elements.)